In many ways, the Internet has set journalists free.
The medium allows journalists to break out of the tried and true written article format and tell stories in richer, more innovative ways.
“(The article) is superb at some things, but it’s not the only way to tell stories, particularly online,” said American Press Institute Executive Director Tom Rosenstiel.
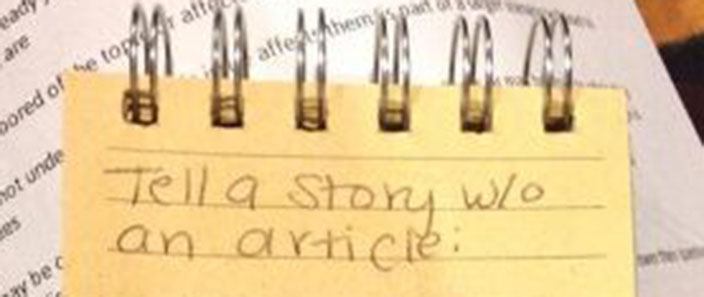
At a packed workshop titled “Oops, We Broke the Article Machine: Imagining What Comes Next,” Rosenstiel and colleagues challenged ONA attendees to find ways to tell different stories without writing a story. While the article isn’t broken, for the sake of this workshop it was. Groups decided to tell stories through data visualizations, interactive timelines and quizzes and social media curation.
Click on each scenario to find some of the ideas workshoppers came up with:
The scenarios
Breaking news
- Crowdsource geo-tagged images and videos. Use the media to populate a map.
- Set up a dynamic timeline or live blog. Post the most up-to-date, confirmed information. Update every 5-10 minutes to stay on top of Google and so readers don’t forget you’re there.
- Add strikethroughs to information if it turns out to be incorrect.
Institutional, long-term beat
- Survey readers to find out what issues they care about most. Try to engage people who wouldn’t normally interact with journalists through social media or through online comments. Compile this information into a dynamic report card to compare what the representative is working on to what residents say they care about.
- You could also crowdsource people’s feelings about elected officials then visualize the responses according to issue. That information can be used to hold officials accountable.
Multi-week story
- A quiz on how the government shutdown affected you. As you answer the questions, it brings you through links readers to past reporting, resources and live meet ups for people who are going through the same thing.
- Create a timeline, charts or a visual glossary explaining jargon and terms that lawmakers use — timeline of the impact on your coverage area.
- Ask readers to submit YouTube videos with their questions, and ask lawmakers to respond to them.
- Create an interactive graphic about local lawmakers with information about their voting record and their legislative calendar.
Complex story with a long view
- Build an app called iClimate, which allows users to input their favorite beach or skill hill and find out about projected water level or temperatures.
- Create a game or interactive about how your behavior impacts the climate. For example, what would happen to your carbon footprint if you rode your bike for five years?
- Debunk climate myths based on user-submitted questions. Users send in their questions, and reporters find the answers.
- Readers write a “fanfiction” of what the world will be like in 2060.
- Data visualization simulating sea level rise and what policies or actions might be in place to try to prevent it.
Long-term story
- Record readers’ questions on videos and get them answered by doctors and experts, or answer them live on a Google Hangout.
- Create a grid to show people’s reaction to the law. Leave the last panel in the grid open to readers can add their own stories.
- Build an interactive timeline summarizing both the history and the future of the Affordable Care Act. Include important deadlines that readers need to know to sign up.
- Create a “Choose Your Own Adventure” interactive to help personalize what the story means to each reader. For example, a reader who does not have insurance will be impacted differently than one who is covered through their employer.


