ONA Student Newsroom
  • Data reveal differences in return to in-person schooling
    • June 26, 2021
  • How three news start-ups approached innovation in 2020
    • June 22, 2021
  • Sports journalists, from left, Matt Musil of KHOW TV, Emily Giangreco of KVUE TV, and John Affleck, the Knight Chair for Sports Journalism at Penn State University.
    Virtual group interviews are changing sports coverage
    • June 22, 2021
  • In their memory: Pandemic offers opportunities to transform digital obits
    • June 21, 2021
  • COVID-19 vaccine incentives: do they work?
    • June 21, 2021
  • Home
  • ONA23 Conference
  • Online Journalism Awards
  • Ethics Tool
  • Knowledge Base
  • ONA Insights
  • Member Log In
ONA Student Newsroom
  • Uncategorized

The Meaning of Metrics: Measuring a Story’s Impact

  • Casey Capachi
  • September 22, 2012
  • 2 minute read
greglinch
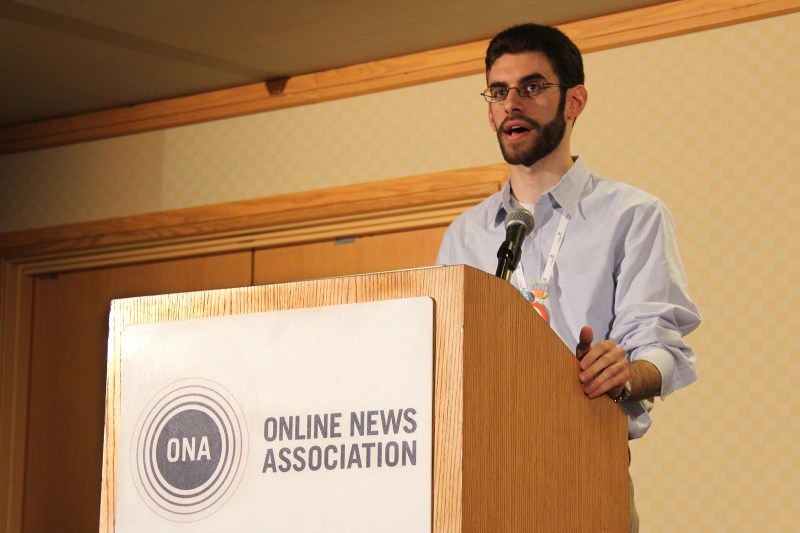
Greg Linch, producer at The Washington Post speaks on Friday’s panel, “Have an Impact. Then Measure it.” Linch also heads the ONA conference’s livestream team, recording the ONA conference’s major events and sessions. (Photo by Casey Capachi).
Total
0
Shares
0
0
0
0
greglinch
Greg Linch, producer at The Washington Post, speaks on Friday's panel, "Have an Impact. Then Measure it." Linch also heads the ONA conference's livestream team, recording the major events and sessions. (Photo by Casey Capachi)

News outlets have more ways of tracking an audience than ever before, but measuring a story’s impact beyond the page view can be challenging.

“The idea of metrics themselves are not bad. But there are bad metrics,” said Greg Linch, speaker on Friday’s panel “Have an Impact. Then Measure it.” “And there are better metrics and worse metrics.”

Some of the better metrics, said Linch, who works as producer for special projects and news applications at The Washington Post, can be found in other industries.

“A lot of fields are doing it. We don’t need to reinvent the wheel,” said Linch.

For example, he said, comedians ask their fans to follow them on their social media accounts after their shows, athletes’ performances are tracked on websites, and researchers follow the response their papers attract.

Qualitative data that demonstrates the impact a story has on the public, Linch said, should not be overlooked for the often easier-to-measure quantitative metrics.

“It’s harder to measure real-world response,” said Linch. “We need more metrics, what page views incentivize versus real world outcomes in terms of whether people are better informed, or is the government more accountable to the people.”

wendylevy
Wendy Levy, co-founder of Sparkwise, helps a conference participant sign up for his first account following the panel discussion. Sparkwise is a free data visualization tool designed for organizations and professionals looking to track engagement with their audience." (Photo by Casey Capachi)

Too often, said Linch, “If we want more interactivity on the site we say, ‘Let’s put up some more polls and quizzes versus just saying what do you think about this?’ Just by asking, ‘What are we achieving by doing this and does it lead to a greater understanding?’ and really allowing purposeful discussion to happen.”

User comments, Linch says, are one part of the reader experience that can still be improved.

“We have to stop treating comments as something separate that happens at the end of stories and integrate them into the process of journalism storytelling,” said Linch. “Finding ways to sort of elevate and incentivize better behavior, better discussion, better discourse. I don’t think anonymity is necessarily the problem.”

News organizations striving to be more interactive, said Linch, should focus on the story and not the medium.

“I think we’ve learned a numbers of times that not everything needs a video, not everything needs a slideshow,” said Linch. “Be purposeful.”

“Online polls are another example,” he said. “They’re basically to the point of being harmful. They don’t say anything, but what they do say could be completely wrong. It depends on who sees it and who clicks on it.”

Linch said we need to move toward multidimensional metrics that take into account not only page views and time spent on the site but also other measures of user interactivity as well.

“The world is complex, the responses to our journalism is complex,” said Linch. “I think our metrics need to be similarly complex.”

For more on measuring the impact of journalism from Linch, visit his site.

Total
0
Shares
Share 0
Tweet 0
Pin it 0
Casey Capachi

University of California Berkeley Graduate School of Journalism

Previous Article
  • Uncategorized

Reforming J-School to Educate “New Journalists”

  • Lindsey Cook
  • September 22, 2012
Read More
Next Article
  • Innovation

Drones: Journalists With Flying Robots

  • Nicholas Slayton
  • September 22, 2012
Read More

Special thanks to our Patron Sponsors
Google News Initiative logo

Content Authenticity Initiative logo

…and our Supporting Sponsors
Microsoft logo
The Atlanta Journal-Constitution logo

Top Articles
  • 1
    Ever heard of a ‘newsgame’? They aren’t as new as you might think
    • September 24, 2022
  • A table with three speakers sit in front of a room with people at round tables 2
    As journalists look to build trust, solutions journalism might help
    • September 24, 2022
  • Why news organizations are pivoting to short-form video and TikTok
    • September 24, 2022
  • screen shot of Zine produced by the ONA Newsroom in 2022 4
    To paper and back again – the #ONAZine
    • September 24, 2022
  • 5
    Women’s Leadership Accelerator cohorts back in person after two years
    • September 24, 2022
@ONANewsroom
My Tweets

Subscribe

Subscribe now to our newsletter

ONA Student Newsroom
Daily conference coverage from ONA's student newsroom

Input your search keywords and press Enter.


Loading Comments...
 

You must be logged in to post a comment.