When I started brainstorming story ideas for the ONA14 conference, I knew that I didn’t want to do anything traditional. I didn’t want to write stories, take photos or shoot photos or video. I wanted to make something different and fun. So, with the help of Jeremy Bowers of The New York Times and Sisi Wei of ProPublica, I built ONA Applause.
ONA Applause is a web app that allowed attendees to give virtual applause to any of the Friday sessions. Attendees could check in to the session they were attending and then be directed to an applause button with a meter. As the attendees held down the button, the meter went up indicating how much applause the attendee gave.

Simple, right? Just two buttons, one linking to the next, with a funny GIF and a minion for effect. What the users do not see is that as they check in and use the app, we have generated a UUID to their device, cookied it and timestamped every time they hit the button. We also measured the duration of how long they held it down.
The front-end was the easy part. The back-end was a whole different story.
The Idea
I pitched the idea of grading the sessions in real time in the middle of the summer. As I was pitching, I did not think about what would go into building my idea or that it would be over my head. I just wanted to make something different that was simple to use but informative and told a story. It was not until the assignments came in two weeks before the conference that I realized that I was in over my head.
Insert Jeremy and Sisi. We planned a quick Google Hangout and started brainstorming what “grading the sessions” could look like. We quickly decided that the app needed to be positive. All the presenters had worked hard on preparing for their sessions and deserved a round of applause. I asked Jeremy and Sisi how they would feel about seeing the results of the app in real time as they presented. They replied that it would put a lot of unneeded stress on the presenters. We also decided that although the app would be deployed online, it would be responsive and built for mobile.
With these points in mind, I made a GitHub repository. Then I started throwing some simple HTML/CSS onto a static page to get the overall look of the app down and settled on a design before the conference.
Learning the Magic of JavaScript
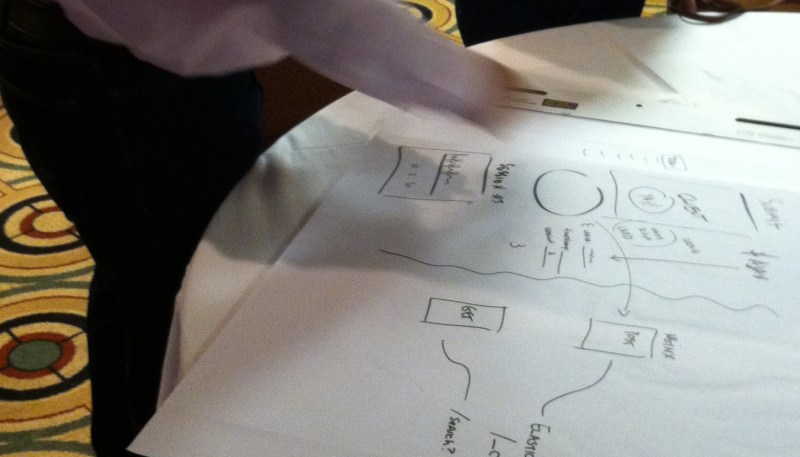
When I arrived at the newsroom on Thursday morning, Jeremy greeted me. He pulled out a giant sticky pad and drew a map of how we would keep track of users, sessions and when they hit the button.
“I’ll take care of the Nginx and elasticsearch that will store all the data that comes in from the users,” Jeremy said. “So what you need to do is send me the users, timestamp and duration in an Ajax.”
To do this, I learned about UUIDs, a 32-bit Universal Unique Identifier of each user. We generated a UUID to every user as well as every session. We then also added a cookie to each user to track them every time they hit the applause button. Lastly, we put a timestamp on the button every time it was hit.
I implemented all of this with Sisi’s help. Quick Google searches led me to GitHub repos. Sisi helped me learn how to take the code I found, attach it to my app and send it off to Jeremy to store in the elasticsearch JSON. Sisi taught me how to write functions that timed the applause button, reset the button, called sessions from a JSON file and sent all the information we gathered off to a giant JSON file that we could use to track the results.
The Results
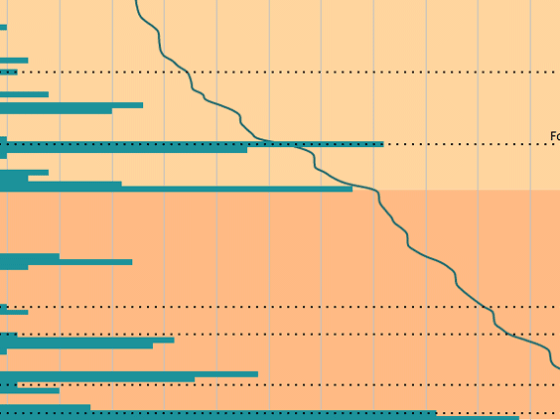
At the end of the day on Friday I had a JSON file that had collected all information from every user that I visualized through the HighCharts API.
Pulling from the giant JSON file that Jeremy generated was as much of a learning experience as posting to it. To pull from the file, Sisi taught me how to loop through the results so that I did not have to type in the results manually.


You must be logged in to post a comment.